Skip to content
Neil Chandler's DB Blog
Search
About Neil
Consultancy Services
Presentations
SQL Scripts
Video Tutorials
Why Has My Plan Changed. Top 7 Plan Stability Pitfalls and How To Avoid Them!
Oracle Database Stats – the easy way!
Oracle Database Statistics – When It’s Harder
Histograms Are Evil like Chocolate is Evil
Oracle Execution Plan Changes
Using JSON in Oracle
MASH Program
Category:
Performance and Tuning
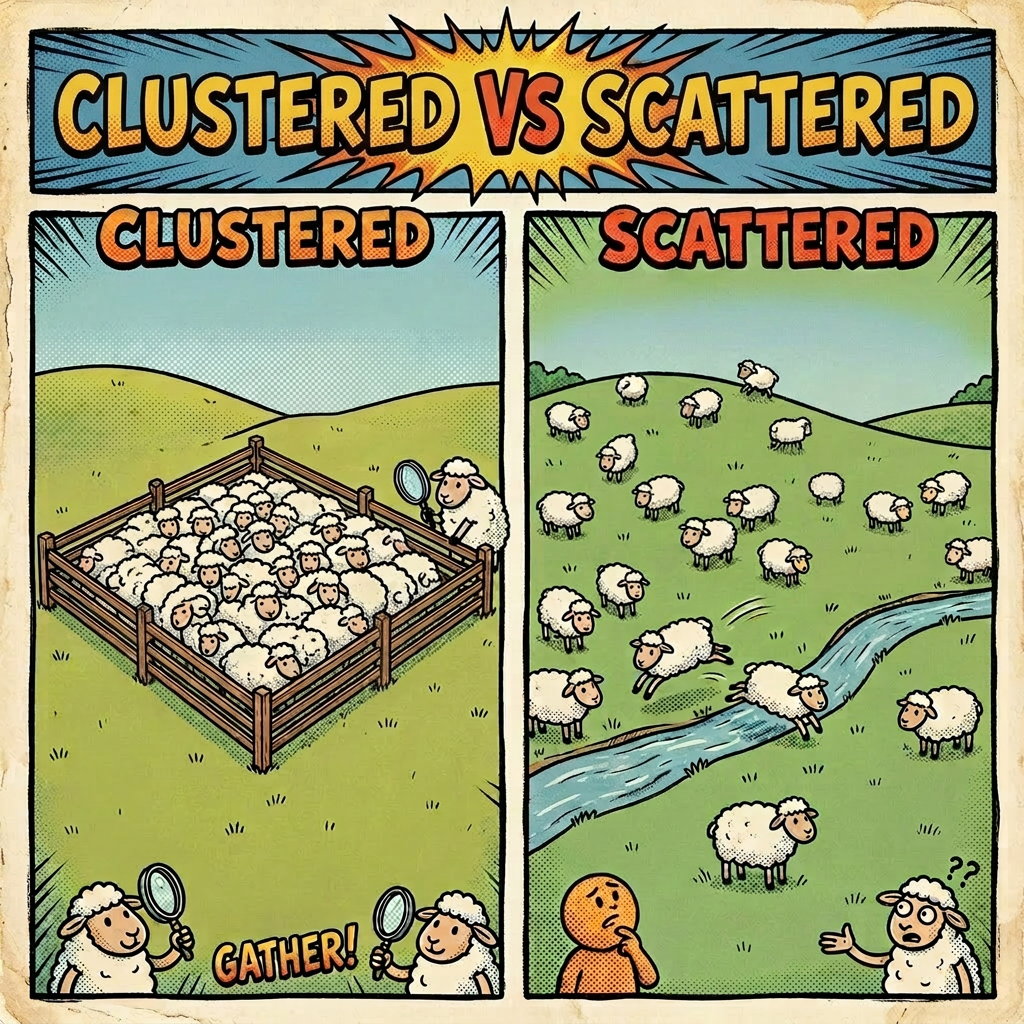
Performance: Clustering Data
Performance: Index Clustering Factor
Oracle Transparent Hugepages
Oracle Database: Global Stats Changes After Partition Truncate
ORA-04021 timeout occurred while waiting to lock object during stats gather
Hint Classifications
SQL Patch, and a Parallel mistake
Oracle Statistics Gathering Timeout
Unexpected Performance Issue with Unified Audit and OEM
Exadata System Statistics
Oracle Optimizer System Statistics
Oracle Table Prefs
Parallel Madness
Where’s my Oracle SQL Plan Baseline?
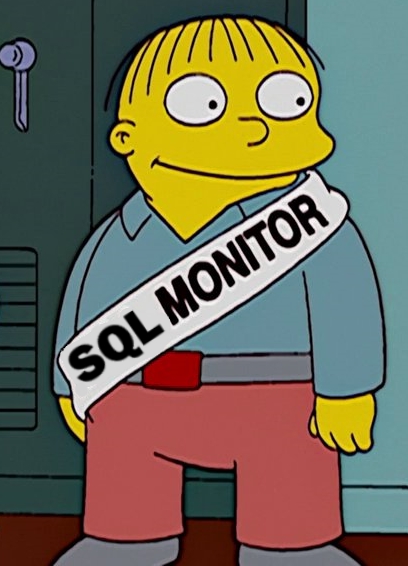
Oracle SQL Monitor not monitoring my SQL
Next Page
Privacy & Cookies: This site uses cookies. By continuing to use this website, you agree to their use.
To find out more, including how to control cookies, see here:
Cookie Policy
Subscribe
Subscribed
Neil Chandler's DB Blog
Join 133 other subscribers
Sign me up
Already have a WordPress.com account?
Log in now.
Neil Chandler's DB Blog
Subscribe
Subscribed
Sign up
Log in
Report this content
View site in Reader
Manage subscriptions
Collapse this bar