Data Guard Unexpected Lag

facepalmWhen configuring a physical standby database for Oracle using Data Guard, you need to create Standby Redo logs to allow the redo to be applied in (near) real time to the Standby. Without standby redo logs, Oracle will wait for an entire Archive Log to be filled and copied across to the standby before it will apply changes, which could take quite a while.

Which leads me to the problem I encountered a while ago, and due to being forgetful, still encounter today when creating standby redo logs in Oracle 12C and 18C.

I have a Primary database with 3 Redo logs, and I have created a Physical Standby database with 3 Redo logs and then 4 Standby Redo logs created as follows:

alter database add standby logfile group 4 '/u01/.../redo_standby04.dbf' size 200M;
alter database add standby logfile group 5 '/u01/.../redo_standby05.dbf' size 200M;
alter database add standby logfile group 6 '/u01/.../redo_standby06.dbf' size 200M;
alter database add standby logfile group 7 '/u01/.../redo_standby07.dbf' size 200M;

And this is what they look like:

SQL> select group#,thread#,sequence#,bytes/1024/1024 MB,status from v$log order by group#;
GROUP#     THREAD#    SEQUENCE#  MB         STATUS
---------- ---------- ---------- ---------- ----------------
1                   1          0        200 UNUSED
2                   1          0        200 UNUSED
3                   1          0        200 UNUSED

SQL> select group#,thread#,sequence#,bytes/1024/1024 MB,status from v$standby_log order by group#;
GROUP#     THREAD#    SEQUENCE#  MB         STATUS
---------- ---------- ---------- ---------- ----------
4                   1        111        200 ACTIVE
5                   0          0        200 UNASSIGNED
6                   0          0        200 UNASSIGNED
7                   0          0        200 UNASSIGNED

SQL> select * from v$logfile order by group#;
GROUP#     STATUS  TYPE    MEMBER 
---------- ------- ------- --------------------------------------------------------------------------------
         1         ONLINE  /u01/.../redo01.dbf
         2         ONLINE  /u01/.../redo02.dbf
         3         ONLINE  /u01/.../redo03.dbf
         4         STANDBY /u01/.../redo_standby01.dbf
         5         STANDBY /u01/.../redo_standby02.dbf
         6         STANDBY /u01/.../redo_standby03.dbf
         7         STANDBY /u01/.../redo_standby04.dbf

So what’s the problem?

Well, Dataguard works as expected for a while – applying change immediately – then it lags for ages and you get an OEM alert that it’s lagging. Then it works fine for a while again and then another lag.

The problem is that when I created the Standby Redo log files, I did not specify the Thread. But why do I need to specify the thread? This is not RAC. It does not have multiple threads for redo – one for each node. We have Thread 1 and that’s it.

When I used to do this in Oracle 11.2, the Standby Redo logs got Thread 1 by default. Always Thread 1.

From Oracle 12.1, and also in 12.2.0.1, 18C (12.2.0.2) and probably 19C (12.2.0.3), Oracle creates the Standby Redo logs with Thread 0 by default, although sometimes it creates them on Thread 1 (although this seems to be only in 12.1 but let me know if you know better). I don’t know why.

Standby Redo log MUST belong to the SAME Thread as the Online Redo logs for them to be used. Having (in this case) 1 x redo on Thread 1 and 3 x Redo on Thread 0, I only have 1 x Standby Redo usable for my online Redo.

The solution is stop the Apply, DROP the Standby Redo on Thread 0, and create new Standby Redo Logs explicity stating Thread 1, and restart the Apply.

dgmgrl> edit database orcl12dr set state='APPLY-OFF';

sql> alter database drop standby logfile          group 4 '/u01/.../redo_standby04.dbf';
sql> alter database add  standby logfile thread 1 group 4 '/u01/.../redo_standby04.dbf' size 200M;

dgmgrl> edit database orcl12dr set state='APPLY-ON';

And all is good with the world.

It is worth saying that MOS note 1595034.1 gets the corrective advice EXACTLY WRONG, with the incorrect snippet reproduced here:

"The standby redo logs can't be used, since they are assigned to thread 0. 
Standby RedoLogs should not be assigned to a specific Thread. 
Please use fallowing statements:
...
SQL> ALTER DATABASE DROP STANDBY LOGFILE GROUP <Group#>; 
and create new SRLs with
SQL> ALTER DATABASE ADD STANDBY LOGFILE GROUP <Group#> SIZE ;"

No MOS analyst! Standby Redo Logs MUST be assigned to a specific thread. Thread 0 Standby Logs are ignored!

And don’t forget, if you are using RAC you need to have Standby Redo Logs for EVERY thread accessible to EVERY instance, just like the Online Redo logs.

If you have single instance, ensure you specify Thread 1, and ensure you have 1 more Standby Redo log available than Online Redo log.

As a final note on Data Guard, from Oracle 12.1 you really should be using the Data Guard Broker to configure and manage Data Guard. It’s simple and it’s much better and safer than configuring Data Guard manually and has some nice validation and monitoring features too.

Addendum: For clarity, not specifying a Thread means that Oracle is supposed to auto-adjust the thread to match what thread is needed, using the Thread 0 as a pool so you presumably need less redo defined in RAC environment, but it just doesn’t work very well (or not at all) leading to the fast/slow/fast/slow lag symptoms. It’s also a pretty pointless saving as redo logs are small relative to the database size. If you have a LOT of nodes in the cluster meaning a lot of standby redo logs, and they aren’t all committing redo heavily (when they will all need all of their standby redo logs anyway) why do you have so many nodes? And validating the setup will report that you don’t have enough standby redo logs. Looks like a solution to something that isn’t a problem for anyone.

So this is an undocumented problem-introducing enhancement in Oracle 12 solving no practical real-world problem.

I’ll let you know if it is fixed in Oracle 19C.

Here’s some real-world output showing the apply lag with Thread 0 SRL’s, and how it disappears when Thread 1 SRL’s are explicitly created. Please note the units and date. I can’t provide the alert log output in this blog to prove my annotations.

SQL> select * from v$standby_event_histogram order by LAST_TIME_UPDATED;

NAME                       TIME UNIT                  COUNT LAST_TIME_UPDATED        CON_ID
-------------------- ---------- ---------------- ---------- -------------------- ----------
apply lag                    43 seconds                   3 01/03/2019 17:22:38           0
apply lag                     9 minutes                  58 01/03/2019 17:30:54           0
apply lag                    11 minutes                  60 01/03/2019 17:32:55           0
apply lag                    12 minutes                  59 01/03/2019 17:33:54           0
apply lag                    13 minutes                  57 01/03/2019 17:34:55           0
apply lag                    14 minutes                  60 01/03/2019 17:35:55           0
apply lag                    15 minutes                  47 01/03/2019 17:36:42           0
apply lag                    10 minutes                  61 01/03/2019 17:36:44           0
-- First SRL Thread 1 created : 2019-01-03T17:39:43.890329+00:00
apply lag                    27 seconds                   9 01/03/2019 17:45:39           0
apply lag                    30 seconds                   5 01/03/2019 17:45:42           0
apply lag                    31 seconds                   7 01/03/2019 17:45:44           0
apply lag                    32 seconds                   6 01/03/2019 17:45:45           0
apply lag                    33 seconds                  10 01/03/2019 17:45:46           0
apply lag                    34 seconds                   8 01/03/2019 17:45:47           0
apply lag                    35 seconds                   9 01/03/2019 17:45:48           0
apply lag                    36 seconds                   7 01/03/2019 17:45:49           0
apply lag                    37 seconds                   5 01/03/2019 17:45:50           0
apply lag                    38 seconds                   8 01/03/2019 17:45:51           0
apply lag                    39 seconds                   7 01/03/2019 17:45:52           0
apply lag                    40 seconds                   3 01/03/2019 17:45:53           0
apply lag                    41 seconds                   3 01/03/2019 17:45:54           0
apply lag                    42 seconds                   4 01/03/2019 17:45:55           0
apply lag                    44 seconds                   4 01/03/2019 17:45:56           0
apply lag                    45 seconds                   7 01/03/2019 17:45:57           0
apply lag                    46 seconds                   5 01/03/2019 17:45:58           0
apply lag                    47 seconds                   7 01/03/2019 17:45:59           0
apply lag                    48 seconds                   4 01/03/2019 17:46:00           0
apply lag                    49 seconds                   8 01/03/2019 17:46:01           0
apply lag                    50 seconds                   5 01/03/2019 17:46:02           0
apply lag                    51 seconds                   6 01/03/2019 17:46:03           0
apply lag                    52 seconds                   8 01/03/2019 17:46:04           0
apply lag                    53 seconds                   7 01/03/2019 17:46:05           0
apply lag                    54 seconds                   6 01/03/2019 17:46:06           0
apply lag                    55 seconds                  10 01/03/2019 17:46:07           0
apply lag                    56 seconds                  11 01/03/2019 17:46:09           0
apply lag                    57 seconds                   8 01/03/2019 17:46:10           0
apply lag                    58 seconds                   6 01/03/2019 17:46:11           0
apply lag                    59 seconds                   7 01/03/2019 17:46:12           0
-- Final SRL Thread 1 created 2019-01-03T17:51:58.694308+00:00
apply lag                     8 minutes                 103 01/03/2019 17:52:55           0
apply lag                     7 minutes                 120 01/03/2019 17:52:56           0
apply lag                     6 minutes                 130 01/03/2019 17:52:58           0
apply lag                     5 minutes                 180 01/03/2019 17:53:00           0
apply lag                     4 minutes                 181 01/03/2019 17:53:03           0
apply lag                     3 minutes                 183 01/03/2019 17:53:06           0
apply lag                     2 minutes                 260 01/03/2019 17:53:11           0
-- All SRL Thread 0's deleted, then ALTER SYSTEM ARCHIVE LOG issued. 2019-01-03T18:19:33.757994+00:00
-- No more APPLY lag for 3 days (any lag reported below -of a few seconds- is due to other reasons)
apply lag                    23 seconds                  10 01/06/2019 18:14:59           0
apply lag                    29 seconds                   8 01/06/2019 18:15:03           0
apply lag                    26 seconds                  10 01/06/2019 18:15:09           0
apply lag                    28 seconds                  10 01/06/2019 18:15:11           0
apply lag                    24 seconds                  12 01/06/2019 18:15:12           0
apply lag                    25 seconds                   9 01/06/2019 18:15:14           0
apply lag                    16 seconds                  33 01/07/2019 11:02:37           0
apply lag                    20 seconds                  17 01/09/2019 11:01:37           0
apply lag                    21 seconds                  29 01/09/2019 11:01:40           0
apply lag                    22 seconds                  19 01/09/2019 11:01:42           0
apply lag                    14 seconds                  50 01/10/2019 00:08:19           0
apply lag                    15 seconds                  44 01/10/2019 00:08:25           0
apply lag                    17 seconds                  17 01/10/2019 00:08:27           0
apply lag                    18 seconds                  23 01/10/2019 00:08:28           0
apply lag                    19 seconds                  21 01/10/2019 00:08:30           0
apply lag                    13 seconds                  73 01/10/2019 00:30:51           0
apply lag                     9 seconds                 170 01/10/2019 00:33:11           0
apply lag                     6 seconds                 426 01/10/2019 01:34:29           0
apply lag                     4 seconds                1304 01/10/2019 11:00:42           0
apply lag                     7 seconds                 294 01/10/2019 11:00:54           0
apply lag                     8 seconds                 222 01/10/2019 11:00:55           0
apply lag                    10 seconds                 117 01/10/2019 11:00:56           0
apply lag                    11 seconds                 109 01/10/2019 11:00:57           0
apply lag                    12 seconds                  90 01/10/2019 11:00:58           0
apply lag                     5 seconds                 726 01/10/2019 11:01:38           0
apply lag                     3 seconds                2911 01/10/2019 11:12:46           0
apply lag                     2 seconds                7866 01/10/2019 11:56:28           0
apply lag                     1 seconds               58544 01/10/2019 11:59:15           0
apply lag                     0 seconds              758505 01/10/2019 12:00:07           0

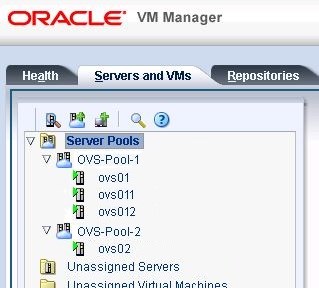
Running RAC in a Virtual Environment

I was in a discussion at an Oracle Meetup this week, and the subject of RAC in a virtualized environment – specifically Oracle Virtual Machine (OVM) – came up.
Here’s a couple of points which were discussed.

pingtarget

There was a lack of awareness of a common problem, which has a solution built-in to Oracle 12.1.0.2 Grid Infrastructure and later. In a virtualized environment, the network components are also virtualized. Sometimes, network failures on the host may not be raised up to the guests. As a result, the guest O/S commands can fail to detect the network failures and the Virtual NIC remains up. Grid Infrastructure (GI) will not perform a VIP fail-over as it can’t see the failure despite the network being unavailable.

To resolve this, Oracle has added an option of a “pingtarget” for each public network defined in GI. This will perform a keep-alive to a external device, usually something like the default gateway. This is just like the heartbeat on the cluster interconnect.

Before

srvctl config network

Network 1 exists

Subnet IPv4: 192.168.0.160/255.255.255.224/eth1, static
Subnet IPv6:
Ping Targets:
Network is enabled
Network is individually enabled on nodes:
Network is individually disabled on nodes:

The default gateway makes a good ping target. For this IP and subnet, it’s 192.168.0.161

srvctl modify network -k 1 -pingtarget 192.168.0.161

After

srvctl config network

Network 1 exists

Subnet IPv4: 192.168.0.160/255.255.255.224/eth1, static
Subnet IPv6:
Ping Targets: 192.168.0.161
Network is enabled
Network is individually enabled on nodes:
Network is individually disabled on nodes:

All safe!

Server Pools

A second item we discussed was the Server Pools in OVM. Each RAC guest should be on a different host, otherwise you have not eliminated that as a Single Point Of Failure. A second less obvious SPOF is the Server Pool disk.

A Server Pool is a filesystem LUN (and IP address prior to release 3.4) used to group a logical collection of servers with similar CPU models, within which we can create and migrate VM guests. For a RAC installation, each RAC node should be within a different server pool, as well as on different physical hardware.

ovs

In this image, RAC nodes within the same cluster should be created within each server pool. This configuration can safely support a 2 node cluster despite having 4 servers, with one node created in “OVS-Pool-2” on server “ovs02“. The second node should be in “OVS-Pool-1″ and can be on “ovs01“, “ovs11” or “ovs12“.

It is possible to live migrate guests between these 3 servers.


Oracle Audit Control part 3 – OS files

Just realized that I wrote a follow-up to Part 2 two years ago and never posted it! So here’s the stripped-out key facts to round off auditing control a bit more:

Deleting O/S audit files is, like, totally necessary. In Oracle 12C (12.1), they are created by default as AUDIT_SYS_OPERATIONS defaults to TRUE now, so you are going to be filling up your AUDIT_FILE_DEST whether you realized it or not.

[NOTE: In theory, this could end up being a performance problem as well as a space problem if you have many millions files in the AUDIT_FILE_DEST. In Oracle 11G, when allocating an AUDIT file, it would check to see if a file for that SPID already existed and add an incremental number, The act of calling vx_dirbread and vx_dirscan can get terribly slow if there are lots of files to wade through. This mechanism is different in 12C but I have not traced the kernel calls to see if the vx_ calls have gone away.]

To cleanup the O/S, we use the same commands as we did in Part 2, but changed to use an AUDIT_TRAIL_TYPE => DBMS_AUDIT_MGMT.AUDIT_TRAIL_OS

You also need to be aware of the RAC_INSTANCE_NUMBER. For database-level audit, it’s irrelevant. For single instance, it is also irrelevant, but with RAC, this parameter tells you which node to clean up as they are all individual installs with their own audit files (assuming a Grid Infrastructure install per node.)

Commands:

-- Show the BEFORE sizes
host ssh server01 du -m -s /u01/app/oracle/admin/ORCL/a*
host ssh server02 du -m -s /u01/app/oracle/admin/ORCL/a*
begin

-- Loop around every instance in the RAC cluster and run the command
for i in (select inst_id from gv$instance)
loop

-- cleanup AUDIT_FILE_DEST (operating system audit files)
-- set cleanup for 60 days
DBMS_AUDIT_MGMT.SET_LAST_ARCHIVE_TIMESTAMP(
AUDIT_TRAIL_TYPE => DBMS_AUDIT_MGMT.AUDIT_TRAIL_OS,
LAST_ARCHIVE_TIME => systimestamp-60,
RAC_INSTANCE_NUMBER => i.inst_id );

-- And cleanup based upon that date
DBMS_AUDIT_MGMT.clean_audit_trail(
audit_trail_type        => DBMS_AUDIT_MGMT.AUDIT_TRAIL_OS,
use_last_arch_timestamp => TRUE);

end loop;

end;
/

-- And check the sizes AFTER
host ssh server01 du -m -s /u01/app/oracle/admin/ORCL/a*
host ssh server02 du -m -s /u01/app/oracle/admin/ORCL/a*


Output:

15:58:56 SYS @ ORCL1 > host ssh server01 du -m -s /u01/app/oracle/admin/ORCL/a*
776 /u01/app/oracle/admin/ORCL/adump
15:58:56 SYS @ ORCL1 > host ssh server02 du -m -s /u01/app/oracle/admin/ORCL/a*
694 /u01/app/oracle/admin/ORCL/adump
15:58:56 SYS @ ORCL1 >
15:58:56 SYS @ ORCL1 > begin
15:58:56   2
15:58:56   3   for i in (select inst_id from gv$instance)
15:58:56   4   loop
15:58:56   5
15:58:56   6      -- cleanup AUDIT_FILE_DEST (operating system audit files)
15:58:56   7      -- set cleanup for 60 days
15:58:56   8      DBMS_AUDIT_MGMT.SET_LAST_ARCHIVE_TIMESTAMP(
15:58:56   9      AUDIT_TRAIL_TYPE => DBMS_AUDIT_MGMT.AUDIT_TRAIL_OS,
15:58:56  10      LAST_ARCHIVE_TIME => systimestamp-50,
15:58:56  11      RAC_INSTANCE_NUMBER => i.inst_id );
15:58:56  12
15:58:56  13      -- And cleanup based upon that date
15:58:56  14      DBMS_AUDIT_MGMT.clean_audit_trail(
15:58:56  15        audit_trail_type        => DBMS_AUDIT_MGMT.AUDIT_TRAIL_OS,
15:58:56  16        use_last_arch_timestamp => TRUE);
15:58:56  17
15:58:56  18   end loop;
15:58:56  19
15:58:56  20  end;
15:58:56  21  /
PL/SQL procedure successfully completed.

15:58:56 SYS @ ORCL1 >
15:58:56 SYS @ ORCL1 > host ssh server01 du -m -s /u01/app/oracle/admin/ORCL/a*
354 /u01/app/oracle/admin/ORCL/adump
15:58:57 SYS @ ORCL1 > host ssh server02 du -m -s /u01/app/oracle/admin/ORCL/a*
364 /u01/app/oracle/admin/ORCL/adump
15:58:57 SYS @ ORCL1 >


And just one final bit. If you change the default

AUDIT_TRAIL=DB to
AUDIT_TRAIL=DB, EXTENDED

the audit writes the first 2,000 characters of the SQL command to DBA_AUDIT_TRAIL.SQL_TEXT, so you get the full text of the SQL command audited, rather than just the action. Very handy!

UKOUG RDBMS and RAC-CIA Special Interest Groups

On Thursday 21st April, there is a dual UKOUG Database and RAC, Cloud, Infrastructure and Availability special interest group.

For the first time, this event is being held in the fabulous Northern city of Manchester!

There are a dozen interesting, career-assisting, educational talks from end users, Oracle employees and a number of well known Oracle ACE’s at all levels, including Carl Dudley, Jonathan Lewis, Phil Brown and myself.

I will be talking about how to troubleshoot Goldengate, showing optimal configurations to assist with problem determination and a bit of staring at Hex dumps for the brave.

There are only a few places left for this popular dual-stream event. Click Here for more details about the talks and speakers, and details for registration.

See you there!

Killing Sessions

You have a session which is out of control. You decide to kill it. What options are available to you as a DBA?

Assuming you don’t have access to the O/S to be able to use O/S commands to kill the session (using kill -9 in Unix/Linux or orakill in windows to kill the thread within the process – “orakill sid thread”), you probably turn to:

alter system kill session 'sid, serial#, @inst_id' immediate;

(note the undocumented @inst_id, which can be used to identify specific RAC instances, rather than the instance you are connected to) Note that immediate does not change the processing, but just returns control to the command line immediately.

You can generate this command using

select 'alter system kill session ''' || sid || ', ' || serial# || ', @' || inst_id || ''';' from gv$session;


However, despite the name, this does not actually kill the session. You may get a pause issuing this command, followed by a “session marked for kill” message. The session then gets a status of “KILLED” in gv$session, but the session does not go away. As a further side effect, frequently the O/S process id is removed from gv$process, so you can’t now locate the process in the O/S to (ora)kill it.

What actually happens is a bit gets set against the session which effectively says “When you next check this bit, kill yourself”. But sometimes the session is busy, is rolling back (check for changing values in gv$transaction.used_urec), is waiting for a reply which never comes or is caught in a tight loop, and never gets around to checking the bit, and so it doesn’t die.

Does anyone know if pmon comes along, notices that you have a session marked for kill, kills it and initiates recovery for the session???

So, what’s a DBA to do? How do I actually kill the session? Step forward little-known command:

alter system disconnect session 'sid,serial#,@inst_id' POST_TRANSACTION | IMMEDIATE

And to generate it:
select 'alter system disconnect session ''' || sid || ', ' || serial# || ', @' || inst_id || ''';' from gv$session;

Again, note the undocumented @inst_id option for RAC.

What this command does is effectively kill the Operating system process. Right now (or after the next commit/rollback if you include the option POST_TRANSACTION.) It is the same as issuing an (ora)kill command.The IMMEDIATE here means “kill it now!”

Bang! and the session is gone.

Don’t kill the wrong session… you may well take your database down.

OEM and monitoring the -MGMTDB GMIR Database

When you create Grid Infrastructure in 12.1.0.2, you are presented with a new (annoyingly named) “-MGMTDB”

This database is a standard, 12C CDB/PDB storing transient performance and other information (Grid Infrastructure Management Repository). If it is lost, no biggie. Just re-create it (in your voting disk DG. Aside: create a new MGMTDB_DG, move your voting disk there, re-create -MGMTDB, then move your voting disk back out to the proper multiple voting volumes.)

However, Oracle Enterprise Manager Cloud Control 12.1.0.5.0 and earlier sees this oracle database, PDB, listener and all, and decides to discover it. This is incorrect and should not happen. It is supposed to be “masked off” from OEM. Monitoring this database system will only lead to false positives and problems where none really exist, and all of the targets should be ignored (as per the attached picture)

OEM-MGMTDB

In a future release of Oracle Enterprise Manager Cloud Control, these targets will no longer be discovered and will automatically remain hidden from view within OEM, once the team have fixed the bug which – I was very reliably informed – they discovered the root cause of today.

Sequences – a quick guide and an unexpected quirk

Sequences on Oracle databases are simple, but there are some basic truths about sequences which need to be understood if you are going to use them, especially on RAC:

  1. Sequences will have “holes” in them, even if you specify NOCACHE (e.g. if you rollback your transaction).
  2. Don’t specify NOCACHE. It doesn’t scale.
  3. Sequences will NOT necessarily be, erm, sequential for your transactions. That will depend upon the COMMIT order and if you are using RAC.
  4. The higher the CACHE value, the bigger the holes but the more scalable the sequence will be become. You will lose the entire set of unused cache values across instance restart.
  5. Oracle stores the CACHE value on EACH RAC node, so for a cache of 100,000, NODE 1 gets 1-100,000, NODE 2 get 100,001-200,000 to play with, and so on.
  6. If you are using RAC, and you have a heavy workload on one node and a low number of transactions on another node, there may be a significant disparity between the NEXTVAL on each node. I have seen this disparity manifest in the tens of millions.
  7. There is a global cache lock which must be passed from node to node when getting a new cache of sequence numbers on that node. It is lightweight, but it is a serialisation point. If your CACHE value is too low for your throughput, you will get contention on this lock.
  8. Same as the serialisation point if you specify ORDERED, so you get the sequences advancing in step (rather than each node having its own cache) on multiple RAC nodes. Don’t do this either.
  9. The point if sequences is to give you a unique value for a (surrogate) Primary Key. You can rely upon sequences to be unique. Well. Mostly. As long as they do not CYCLE.
  10. If you use sequences for a PK, you will probably end up with a right-hand index with hot-block contention during inserts, causing you to implement something suboptimal, like hash partitioning or reverse-key indexes to get around your design flaw.

Sequences on RAC can behave in unexpected ways. The below example is a little contrived but shows a potentially unexpected behaviour caused by CYCLEing your sequences:

NODE 1 NODE 2
create sequence seq_1
start     with 1
increment by   1
maxvalue       10
cache          2
cycle;

Sequence created.

NODE1 :select seq_1.nextval from dual;
NEXTVAL: 1
NODE2 :select seq_1.nextval from dual;
NEXTVAL
3 <- Gets next value above cache on node 1
NODE1 : /
NEXTVAL: 2
NODE1 : /
NEXTVAL: 5 (skipping 3 and 4 on Node 2)
6
7
8
9
10
1
2
3  <- erm. Hang on. Node 2 has this!
4  <- and this!!!
5
6
7
8
9
10
1
NODE2 : /
NEXTVAL
4 <- Reading from the local cache
NODE2 : /
NEXTVAL
3 <- And get a new cache value

So, if you are using sequences and you can’t guarantee sequence and you can’t guarantee no gaps and, as this demo shows, you can’t guarantee uniqueness, and they cause hot block right hand index problems, tell me again why you are using them?

Because they are fast and you don’t CYCLE them.

However, sequences are becoming the new evil in the database, right behind triggers.

Extending an ACFS filesystem dynamically.

To extend an ACFS cluster filesystem dynamically, we need to use the acfsutil command:

node01:/u01/grid>/sbin/acfsutil size +10G /u02
acfsutil size: ACFS-03008: The volume could not be resized.  The volume expansion limit has been reached.
acfsutil size: ACFS-03216: The ADVM compatibility attribute for the diskgroup was below the required
                           version (11.2.0.4.0) for unlimited volume expansions.

Oh dear, not 11.0.2.4, so you can only extend volumes dynamically a few times (5) before the global bitmap becomes full. So, now it’s an offline change. 😦

Check what is accessing /u02 and stop it:

node01:/opt/oracle>sudo -s
[root@node01 oracle]# lsof /u02

COMMAND   PID   USER   FD   TYPE    DEVICE SIZE/OFF NODE NAME
bash     5566 oracle  cwd    DIR 252,50177    12288   78 /u02/goldengate/bin11
su      29509   root  cwd    DIR 252,50177    12288   78 /u02/goldengate/bin11

erm. kill -9 5566 29509 :-)

DO THIS ON EVERY RAC NODE!

[root@node01 oracle]# umount –t acfs /u02
[root@node02 oracle]# umount –t acfs /u02
[root@node-n oracle]# umount –t acfs /u02

Once unmounted, we can “repair” the global bitmap:

[root@node02 oracle]# fsck -y -t acfs  /dev/asm/acfsdisk_u02-98
fsck from util-linux-ng 2.17.2
version                   = 11.2.0.4.0
*****************************
********** Pass: 1 **********
*****************************
Oracle ASM Cluster File System (ACFS) On-Disk Structure Version: 39.0
 ACFS file system created at: Thu Jan  2 17:08:02 2014
 checking primary file system
 Files checked in primary file system: 25%
 Files checked in primary file system: 100%

 fsck.acfs: ACFS-07728: The Global_BitMap file has reached the maximum number of extents (5).
 The file system can no longer be expanded. 

 Running fsck.acfs in fixer mode will attempt to consolidate the storage bitmap into 
 fewer extents which would allow for file system expansion

 Checking if any files are orphaned...
 0 orphans found
 Checker completed with no errors.

So lets fix it – output seriously trimmed, but with the important bit

[root@node02 oracle]# /sbin/fsck.acfs -a -v /dev/asm/acfsdisk_u02-98
fsck from util-linux-ng 2.17.2
version                   = 11.2.0.4.0
 *****************************
 ********** Pass: 1 **********
 *****************************
 Oracle ASM Cluster File System (ACFS) On-Disk Structure Version: 39.0
 ACFS file system created at: Thu Jan  2 17:08:02 2014

 checking primary file system
 Files checked in primary file system: 25%
 Files checked in primary file system: 100%

 fsck.acfs: ACFS-07729: The Global_Bitmap file has been
 consolidated into 2 extents.
 This may allow for file system expansion via the 'acfsutil size' command.
  
 Checking if any files are orphaned...
 0 orphans found
 Checker completed with no errors.

So, we’re done and can re-mount ON EVERY NODE. Given it’s now 2 extents, and the max we can have is 5, we have 3 more dynamic extensions before we need to do this again.

mount –t acfs /dev/asm/acfsdisk_u02-98 /u02

And re-attempt to expand the filesystem

node01:/u01/grid>df –h /u02
Filesystem              Size  Used Avail Use% Mounted on
/dev/asm/acfsdisk_u02-98  325G   36G  290G  12% /u02

node01:/u01/grid>/sbin/acfsutil size +10G /u02
acfsutil size: new file system size: 359703511040 (343040MB)
node01:/u01/grid>df -h

node01:/u01/grid>df -h /u02
Filesystem              Size  Used Avail Use% Mounted on
/dev/asm/acfsdisk_u02-98  335G   36G  300G  11% /u02
node01:/u01/grid>

Yey! Bigger filesystem! Lets minimise the amount of times it needs to be extended in the future but doing it in big lumps. Might just save a planned outage.


Alternatively, upgrade Grid Infra to at least 11.2.0.4 and set advm compatibility to 11.2.0.4 and the restriction will be gone for good:

ALTER DISKGROUP acfsdisk SET ATTRIBUTE 'compatible.asm' = '11.2.0.4', 'compatible.rdbms' = '11.2.0.4', 'compatible.advm' = '11.2.0.4';
(or ASMCMD [+] > setattr -G acfsdisk compatible.advm 11.2.0.4)
(or right-click on the disk group in asmca and click "edit attributes")

Grid Infrastructure Disk Space Problem – CHM DB file: crfclust.bdb

The Grid Infrastructure filesystem was reporting that it was a bit full today (release 11.2.0.4). This was tracked down to the “crfclust.bdb” file, which records information about the cluster health for monitoring purposes. It was 26GB. It’s not supposed to get bigger than 1GB so this is probably a bug, but let’s explicitly resolve the size issue right now and search Oracle support later. Worst case, bdb (Berkerley Database) files get regenerated when CHM (ora.crf) resource is restarted.  You only lose the (OS) statistics that CHM has gathered. Deleting bdb files does not have other impact.  CHM will start collecting the OS statistics again.


df –h /u01

Filesystem                Size  Used Avail Use% Mounted on
/dev/sdc1                  48G   36G  9.0G  81% /u01

pwd
/u01/app/11g/grid/crf/db/node01

ls -lh
total 29G

-rw-r–r– 1 root root 2.1M Jul 22 12:12 22-JUL-2014-12:12:03.txt
-rw-r–r– 1 root root 1.3M Apr 23 14:28 23-APR-2014-14:28:04.txt
-rw-r–r– 1 root root 1.2M Apr 23 14:33 23-APR-2014-14:33:34.txt
-rw-r–r– 1 root root 1.3M Jul 23 12:53 23-JUL-2014-12:53:02.txt
-rw-r–r– 1 root root 946K Apr 26 03:57 26-APR-2014-03:57:21.txt
-rw-r—– 1 root root 492M Aug 26 10:33 crfalert.bdb
-rw-r—– 1 root root  26G Aug 26 10:33 crfclust.bdb   <-26G!
-rw-r—– 1 root root 8.0K Jul 23 12:52 crfconn.bdb
-rw-r—– 1 root root 521M Aug 26 10:33 crfcpu.bdb
-rw-r—– 1 root root 513M Aug 26 10:33 crfhosts.bdb
-rw-r—– 1 root root 645M Aug 26 10:33 crfloclts.bdb
-rw-r—– 1 root root 418M Aug 26 10:33 crfts.bdb
-rw-r—– 1 root root  24K Aug  1 16:07 __db.001
-rw-r—– 1 root root 392K Aug 26 10:33 __db.002
-rw-r—– 1 root root 2.6M Aug 26 10:33 __db.003
-rw-r—– 1 root root 2.1M Aug 26 10:34 __db.004
-rw-r—– 1 root root 1.2M Aug 26 10:33 __db.005
-rw-r—– 1 root root  56K Aug 26 10:34 __db.006
-rw-r—– 1 root root  16M Aug 26 10:17 log.0000008759
-rw-r—– 1 root root  16M Aug 26 10:33 log.0000008760
-rw-r—– 1 root root 8.0K Aug 26 10:33 repdhosts.bdb
-rw-r–r– 1 root root 115M Jul 22 12:12 node01.ldb

Lets see how big the repository is…

oclumon manage -get repsize
CHM Repository Size = 1073736016

Wow.  Seems a bit oversized. Change the repository size to the desired number of seconds, between 3600 (1 hour) and 259200 (3 days)

oclumon manage -repos resize 259200

node01 –> retention check successful
node02 –> retention check successful

New retention is 259200 and will use 4524595200 bytes of disk space
CRS-9115-Cluster Health Monitor repository size change completed on all nodes.

If we now check the size, we get an error as the repository is bigger than the max allowed size.

oclumon manage -get resize
CRS-9011-Error manage: Failed to initialize connection to the Cluster Logger Service

So we need to stop and start the ora.crf service to get everything working again. It should be OK to do this on a running system with no impact, but I’d start with your sandpit to test it. Don’t take my word for it!

Check for process:

node01:/u01/app/11g/grid/bin>ps -ef |grep crf
root     26983     1  0 10:44 ?        00:00:00 /u01/app/11g/grid/bin/ologgerd -m node02 -r -d /u01/app/11g/grid/crf/db/node01

Stop service:
node01:/u01/app/11g/grid/bin>crsctl stop res ora.crf -init

CRS-2673: Attempting to stop ‘ora.crf’ on ‘node01’
CRS-2677: Stop of ‘ora.crf’ on ‘node01’ succeeded

Start Service:
node01:/u01/app/11g/grid/bin>crsctl start res ora.crf -init
CRS-2672: Attempting to start ‘ora.crf’ on ‘node01’
CRS-2676: Start of ‘ora.crf’ on ‘node01’ succeeded

Check for Process:
node01:/u01/app/11g/grid/bin>ps -ef  |grep crf
root     28000     1  5 10:49 ?        00:00:00 /u01/app/11g/grid/bin/ologgerd -m node02 -r -d /u01/app/11g/grid/crf/db/node01

Check the size – as specified:
node01:/u01/app/11g/grid/bin>oclumon manage -get repsize

CHM Repository Size = 259200

Done

And the space is released and reclaimed.

node01:/u01/app/11g/grid/bin>df –h /u01

Filesystem                Size  Used Avail Use% Mounted on
/dev/sdc1                  48G  7.7G   38G  18% /u01

The space has been returned. Marvellous.
Now repeat the stop/start on each node.


UPDATE: From Oracle Support: Having very large bdb files (greater than 2GB) is likely due to a bug since the default size limits the bdb to 1GB unless the CHM data retention time is increased.  One such bug is 10165314.

SCAN listener logs – where are they?

These are a bit of a pain as their location isn’t intuitive. So to remind me where they are:

Login to the server(s) as the grid owner and check the scan listener status. This will show you the location of the listener log. cd to just below the diag directory and you’re off!:

server-name:/u01/grid>ps -ef | grep SCAN
 grid 8542 8282 0 10:20 pts/0 00:00:00 grep SCAN
 grid 9349 1 0 Mar07 ? 00:07:33 /u01/app/11g/grid/bin/tnslsnr LISTENER_SCAN1 -inherit

server-name:/u01/grid>lsnrctl status LISTENER_SCAN1
LSNRCTL for Linux: Version 11.2.0.4.0 - Production on 28-MAY-2014 10:20:12
Copyright (c) 1991, 2013, Oracle. All rights reserved.
Connecting to (DESCRIPTION=(ADDRESS=(PROTOCOL=IPC)(KEY=LISTENER_SCAN1)))
 STATUS of the LISTENER
 ------------------------
 Alias LISTENER_SCAN1
 Version TNSLSNR for Linux: Version 11.2.0.4.0 - Production
 Start Date 07-MAR-2014 17:27:50
 Uptime 81 days 15 hr. 52 min. 21 sec
 Trace Level off
 Security ON: Local OS Authentication
 SNMP OFF
 Listener Parameter File /u01/app/11g/grid/network/admin/listener.ora
 Listener Log File /u01/app/11g/grid/log/diag/tnslsnr/server-name/listener_scan1/alert/log.xml
 Listening Endpoints Summary...
 (DESCRIPTION=(ADDRESS=(PROTOCOL=ipc)(KEY=LISTENER_SCAN1)))
 (DESCRIPTION=(ADDRESS=(PROTOCOL=tcp)(HOST=10.6.148.141)(PORT=1521)))
 Services Summary...
 Service "FRONT_APP_DB_SVC.WORLD" has 2 instance(s).
 Instance "ORCL1", status READY, has 1 handler(s) for this service...
 Instance "ORCL2", status READY, has 1 handler(s) for this service...
 Service "ORCL.WORLD" has 2 instance(s).
 Instance "ORCL1", status READY, has 1 handler(s) for this service...
 Instance "ORCL2", status READY, has 1 handler(s) for this service...
 Service "ORCLXDB.WORLD" has 2 instance(s).
 Instance "ORCL1", status READY, has 1 handler(s) for this service...
 Instance "ORCL2", status READY, has 1 handler(s) for this service...
 The command completed successfully

server-name:/u01/app/11g/grid/log>cd /u01/app/11g/grid/log
server-name:/u01/app/11g/grid/log>adrci
ADRCI: Release 11.2.0.4.0 - Production on Wed May 28 10:22:47 2014
Copyright (c) 1982, 2011, Oracle and/or its affiliates. All rights reserved.
ADR base = "/u01/app/11g/grid/log"
 adrci> show homes
 ADR Homes:
 diag/asmcmd/user_grid/server-name
 diag/tnslsnr/server-name/listener_scan3
 diag/tnslsnr/server-name/listener_scan2
 diag/tnslsnr/server-name/listener_scan1
 diag/asmtool/user_root/host_3797755080_80
adrci> show alert
Choose the alert log from the following homes to view:
1: diag/asmcmd/user_grid/server-name
 2: diag/tnslsnr/server-name/listener_scan3
 3: diag/tnslsnr/server-name/listener_scan2
 4: diag/tnslsnr/server-name/listener_scan1
 5: diag/asmtool/user_root/host_3797755080_80
 Q: to quit
Please select option: 4

and there we are…
remember to be on the correct host for each scan,
otherwise the alert (listener) log file will be out of date.