Parallel Madness
19/03/2019 14 Comments
 I’ve noticed at a few clients with data warehouses recently that the Developers and, upon occasion, Business Users have a real fondness for hinting the SQL they are producing with one particular hint. PARALLEL.
As any fule kno, this IS the magic go-faster hint. PARALLEL(2) is obviously twice as fast as serial execution. PARALLEL(4) is amazing and PARALLEL(64) like Usain Bolt on Red Bull.
The problem is that, like all database features, parallel query comes with a cost.
When you specify /*+ PARALLEL(n) */ you are telling the optimizer that it has a lot more resources to use to complete this particular query. Not a single thread but many. PARALLEL(10) will use 21 processes to complete its execution – 20 Parallel Execution Server (10 producers, 10 consumers) and a coordinator (which is your connections shadow process) which will deal with any aspects of the parallel plan which cannot be parallelised.
Allowed free reign to use PARALLEL, devs and users will quickly consume all of the resources available on a given server, causing contentions which will inevitably slow down the overall execution of every piece of code executing on there. To illustrate this, I’d like to use an example I came across a while ago to show how excess PARALLEL of a single statement can be problematic itself.
Lets say I have a single server with 16 cores, lots of memory and a decent SSD array so the problem will centre around the CPU. Inevitably your 16 cores will be hyperthreaded. This then looks to Oracle like you have 32 cores. Whilst Oracle knows you have 16 hyperthreaded cores, you get CPU_COUNT=32
NOTE: 16 cores hyperthreaded DO NOT have the power of 32 cores, especially when dealing with databases. Some database workloads are actually WORSE with hyperthreading enabled (e.g. Data Warehouse systems on SQL Server). Inevitably the server admins will have enabled it unless you can provide cast-iron evidence to have it disabled.
I have a statement which the users are complaining about. It starts with the following code: SELECT /*+ PARALLEL */ (complex multi-table join)
So what does this unrestricted (and therefore DEFAULT!) degree of parallelism (DOP) do in this case?
The default DOP is defined as PARALLEL_THREADS_PER_CPU x CPU_COUNT=2 x 32 = PARALLEL(64)
On RAC it is PARALLEL_THREADS_PER_CPU x CPU_COUNT x INSTANCE_COUNT!
Lets have a look at the ACTIVITY of this PARALLEL(64) query:

You can see from the screenshot that Oracle knows there are 16 cores but it has gone PARALLEL(64), using 128 parallel exection slaves and fully expecting to have the available resources to run PARALLEL(64) efficiently. The execution plan is calculated around this assumption. There are 64 parallel execution slaves attempting to work on this at the same time. It’s worth looking at the metrics associated with this query.
Peaks of 2GB/s disk, 140GB of TEMP and 32 CPU’s.
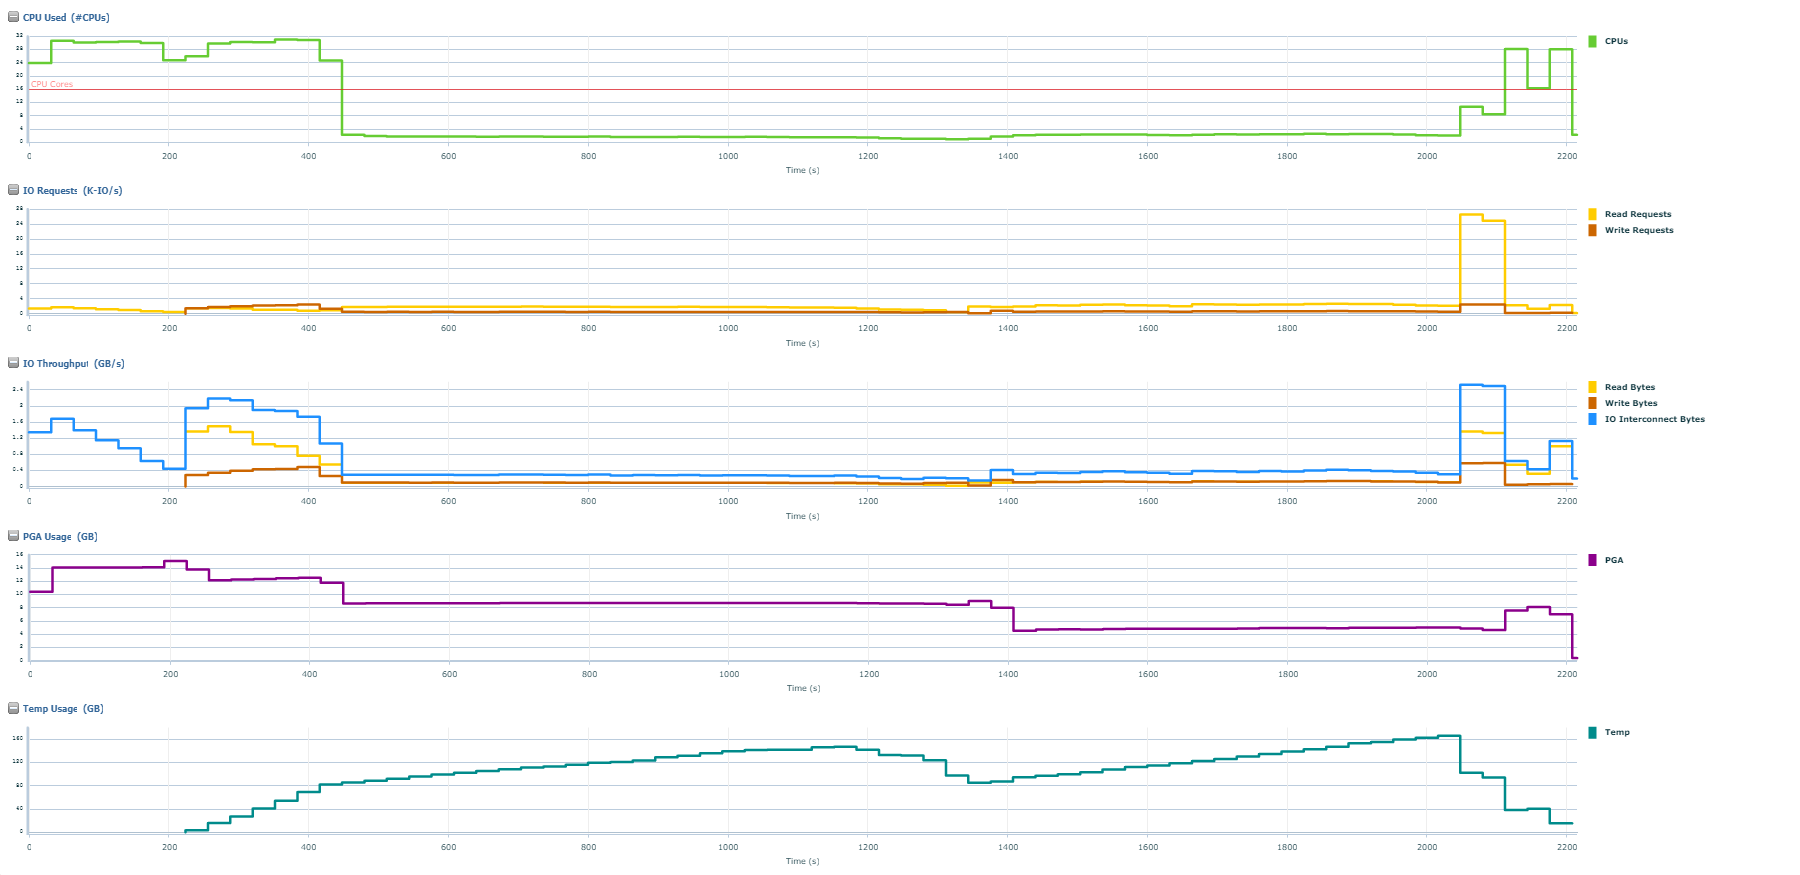
The query took 36.9 minutes to complete.
I had the query changed to inject a modicum of realism into the available resources at the time of the run, and restricted the DOP to PARALLEL(8).

Oracle is restricted to the limited amount of resource, which is availble. The execution plan is different, to reflect the lower amount of available resources. Looking at the metrics:
Peaks of 1GB/s, 3GB of TEMP and 12 CPU’s.

The query took 10.3 minutes to complete. 3 times quicker!
It is worth noting that testing the query in isolation with PARALLEL(16) took 7 minutes to complete, but that DOP would have resource-starved the server as a whole causing everything else currently executing to slow down, and was discounted as an option.
With PARALLEL, less can be better.
Using PARALLEL for everything can be counter-productive.
Co-ordinating PARALLEL across multiple RAC nodes can be disasterous without careful design to take advantage of this feature (using PARALLEL_LOCAL_FORCE=TRUE will restrict parallel processing to a single node). Oracle recommend you don’t do this. Other opinions are available and I generally recommend setting this to TRUE.
We have a limited amount of resources on our servers. Working within those resource limitations will provide substantial benefits.
Before using Parallel processing, I’d recommend thoroughly reading the VLDB and Partitioning Guide appropriate to your database release!
If you use PARALLEL:
- Use Resource Manager to restrict DOP appropriately for different groups of users.
- Consider setting PARALLEL_LOCAL_FORCE=TRUE
- Consider setting PARALLEL_THREAD_PER_CPU=1, especially where you have hyperthreading enabled.
- Consider your overall workload, not just the SQL you are working with right now.


thank you for sharing this post.
Foued
LikeLike
Here’s a curious parallel one that I just looked up … slightly different angle… but…
select px_servers_requested, px_servers_allocated, elapsed_time from v$sql_monitor where sql_id = '7vfd4cgnc9thh';

PX_SERVERS_REQUESTED PX_SERVERS_ALLOCATED ELAPSED_TIME
-------------------- -------------------- ------------
                 334                    0     18378676
SQL is just select * from view, view is a bit messy with a nasty ordered hint and a couple of index hints.
From sql monitor:
Inconsistencies in execution started / finished time and elapsed_time point at the mental parse time going on.
It’s reported as 100% DOP downgrade but ASH shows a varying number of slaves, up to 192, in parse for approx 16 minutes (blocked by the one which happens to have managed to get in to do a hard parse) and when eventually all that parse stuff finishes only one session seems to do the 18s execution…
And all because one of the indexes was accidentally left with degree = 16.
I suppose if you leave open the gate to as much parallelism as you want or all the temp space your application might need then some bullock will eventually stampede into that field in some form or another…
I’m often guilty of firing a quick parallel query at the database and hoping it complete before anyone notices I was there 🙂
LikeLiked by 1 person
Sssssh! You should have seen me testing the parallel(64) 👀
And I’m as guilty as the next DBA for building an index in parallel, and then forgetting to change the setting post-create…
LikeLiked by 1 person
I just realised the absurdity of this evidence I posted (in relation to a similar but less extreme example on a different system with a parse problem… where you see a few queries with parallel slaves waiting on the hard parse and subsequently downgraded)
So a query starts running with DOP of 96… 192 slaves wait for the hard parse which one session is doing and when it happens the runtime decision is to downgrade 100% to a serial execution?
Really?
LikeLike
I found another execution of the same query where it did get what it wanted!
Fortunately this isn’t a particularly busy system so the sql monitor information from 15th is still available!
Execution Started : 03/15/2019 04:12:50
First Refresh Time : 03/15/2019 04:12:50
Last Refresh Time : 03/15/2019 04:12:58
Parallel Execution Details (DOP=168 , Servers Allocated=336)
LikeLike
You have SQL Monitor going back DAYS?!?!
I have SQL Monitor in some of the systems here going back almost 5 minutes, on a good day.
LikeLike
I know! Symptomatic of over-provisioned resources and DW that is loaded once and not then heavily queried. A lot of the data gets sucked back out and then sliced and diced elsewhere.
LikeLiked by 1 person
Also – parallel statement queueing a great means to keep server from getting smooshed
LikeLike
Doesn’t that mean you need to have “parallel_degree_policy=AUTO” set, which is probably not a good idea on the system referenced in the blog post 🙂
LikeLike
The correct answer is Resource Management !
LikeLiked by 1 person
Thank you for sharing.
LikeLike
Pingback: A few more blogs! – OBIEE News
Pingback: Some of the best bits of 2019 – OBIEE News
Pingback: Some of the best bits of 2019 – Oracle Business Intelligence