

This is the best database activity report you gan generate from the command line!
You have a performance issue. Something is going slowly. You only have access to the command line because maybe you don’t have Oracle Enterprise Manager. But you want a nice visual report of what’s going on in the database. Or maybe you want something to keep for future reference, something portable, self contained. Something you can email to interested parties.
Step forward DBMS_PERF.REPORT_PERFHUB
Here’s a few screenshots of the report – this is a single ACTIVE .html file, only a few hundred KB in size. Small, portable, fixed in time. A perfect little personal archive of what was happening for the time period in your database.
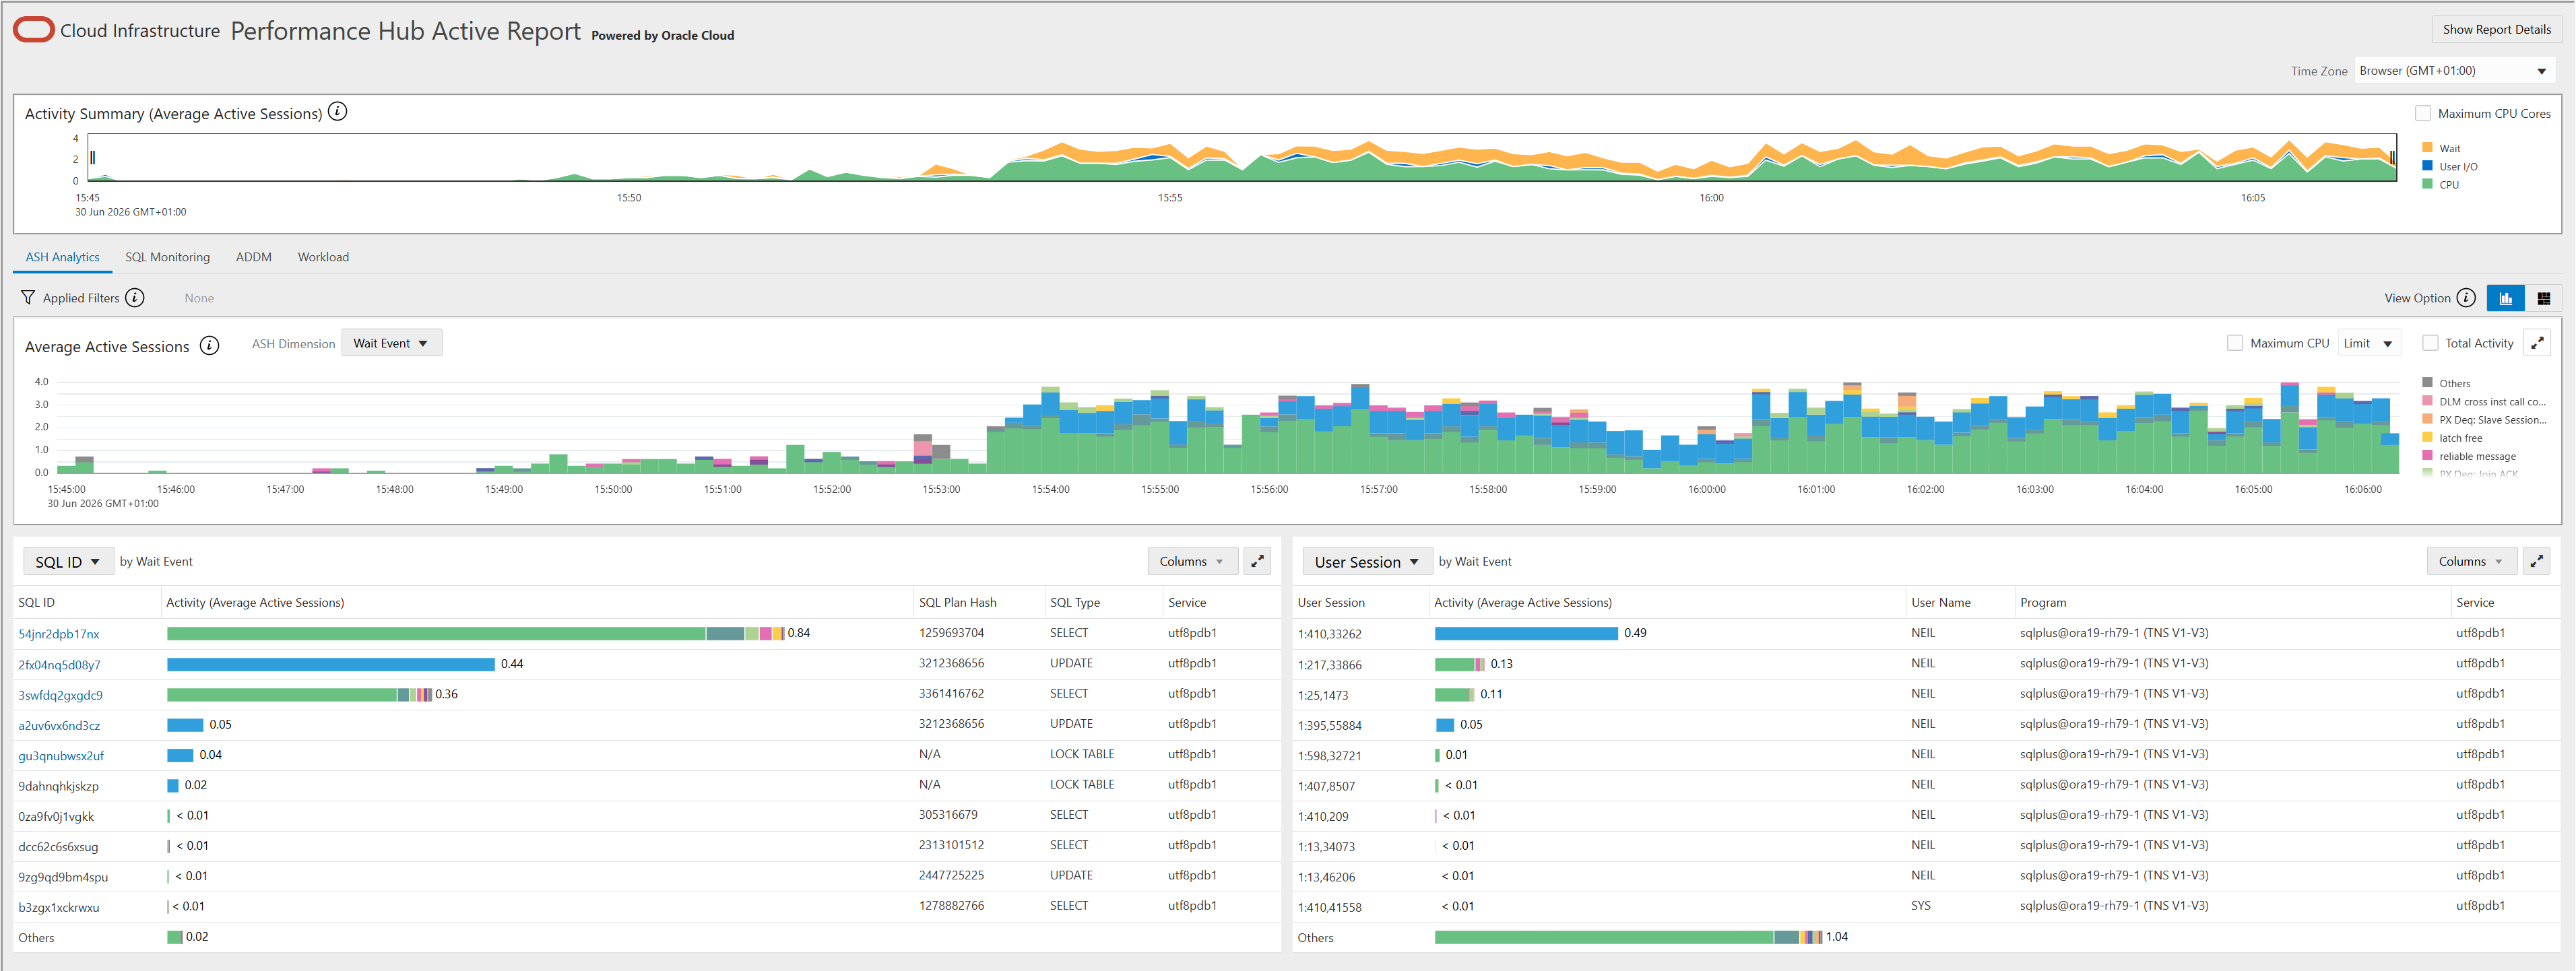


The good: The report itself is fabulous. Active, clickable, loads of information.
The bad: You need DBA Privs to run it. It you want to allow a non-DBA (or a DBA who does not use DBA Privs regularly) to be able to run this, you are going to have to create a small stored procedure under SYS to call this… not ideal.
It’s sometimes a little fragile and doesn’t work – the odd spurious error
Also, in this static report the “selecter” panel doesn’t work for the static report (only in OCI). You can’t change the selection once generated so I recommend always having “selected” times matching the “outer” times (the report size) so everything is selected. This is what the script below does.
There is a 2nd procedure dbms_perf.REPORT_SQL, which takes a SQL_ID as input and gives lots of information about that individual SQL. I personally don’t use that as much, – it is very similar to the dbms_sqltune.report_sql_monitor report.
The ugly: For formatting and rendering the report needs an internet connection to oracle.com. There is facility within the interface to point to a local store for the CSS files BUT this is not supported as a copy of the rendering code isn’t supplied by Oracle so… for Oracle internal use only.
There’s a 3rd procedure to produce a report by session [REPORT_SESSION]. This does not work and, though documented, is for Oracle (OCI) internal use only (when this is called through OCI).
Here’s a script I use to generate the .html file, It gives you some nice prompts, allows defaults to 1 hour. Shows how far you can go back with ASH (and therefore highly detailed) BUT you can also generate this with AWR data. Don’t expect any active SQL Monitoring in a historic report though…
-- perf_monrep.sql v1.0 n chandler Generate a perfhub active report with a bit of a wrapper to help with the inputs---- create an active html monitoring report like OEM ASH report-- REQUIR£ED DIAGNOSTICS PACK LICENSE----for a specific SQL. Commented out as rately used by me.--define sql_id--undefine sql_id--prompt Enter sql_id for report &&sql_id--spool perf_monrep.&&sql_id..html--select dbms_perf.REPORT_SQL(SQL_ID=>'&&sql_id') as report from dual;--spool offset pages 5000 lines 250col time_now for a22 new_value def_endcol h1 for a22 new_value def_startcol oldest_ash for a22undefine start_timeundefine end_timepromptprompt Useful date info for inputprompt ==========================promptSELECT MIN(TO_CHAR(SAMPLE_TIME,'YYYY-MM-DD HH24:MI:SS')) oldest_ash ,TO_CHAR(sysdate-(1/24) ,'YYYY-MM-DD HH24:MI:SS') h1 ,TO_CHAR(sysdate ,'YYYY-MM-DD HH24:MI:SS') time_now FROM v$active_session_history;-- These sqlplus settings are important, otherwise the report does NOT work!set feed off pages 0 lines 32767 trimspool on trim on long 1000000 longchunksize 10000000col report for a32767col spl new_value spool_gen NOPRINTSELECT name||'_'||TO_CHAR(sysdate,'YYYYMMDD_HH24MISS') spl FROM v$database;accept start_time def "&&def_start" prompt "Enter Start Time [&&def_start] "accept end_time def "&&def_end" prompt "Enter End Time [&&def_end] "spool perfmon.&&spool_gen..htmlSELECT dbms_perf.report_perfhub ( is_realtime => 1 ,outer_start_time => TO_DATE('&&start_time','YYYY-MM-DD HH24:MI:SS') ,outer_end_time => TO_DATE('&&end_time' ,'YYYY-MM-DD HH24:MI:SS') ,selected_start_time => TO_DATE('&&start_time','YYYY-MM-DD HH24:MI:SS') ,selected_end_time => TO_DATE('&&end_time' ,'YYYY-MM-DD HH24:MI:SS') ) AS report FROM dual;spool offprompt Now copy the file perfmon.&&spool_gen..html to a location withi has internet accessprompt as the formatting needs to by dynamically downloaded from oracle.comset pages 5000 lines 250
Now, this has been blogged about before
(e.g. https://blogs.oracle.com/coretec/post/oracle-performance-hub )
but I still don’t see it being used widely. Which is surprising.
If you’re licensed for DIAGNOSTICS pack, check it out!
If you want to have a click around the report I used for the screenshots above, it’s here.
http://chandler.uk.com/perfmon_UTF8_20260630_160625.html
The website is http (no cert), so may warn you if you try to access it. 🙂
It’s just a report from a small sandbox database with a couple of SQL’s running in it, so don’t expect anything amazing – but it’s ideal to give you an idea about what the report can do for you.







Leave a comment